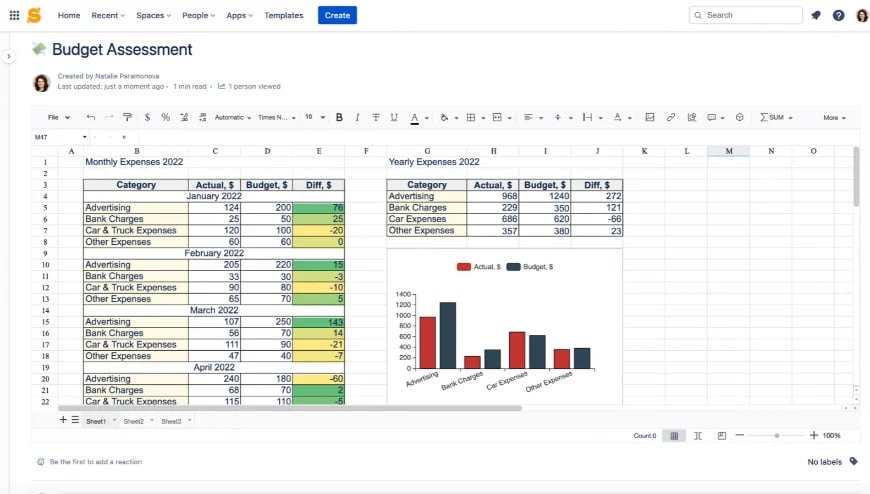
Versatile and easy to use tool for managing tables and data in Confluence, building charts and spreadsheets
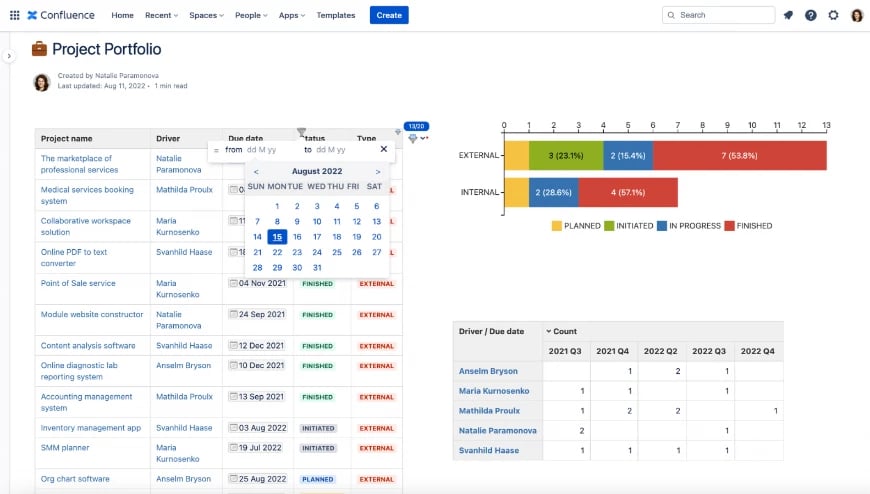
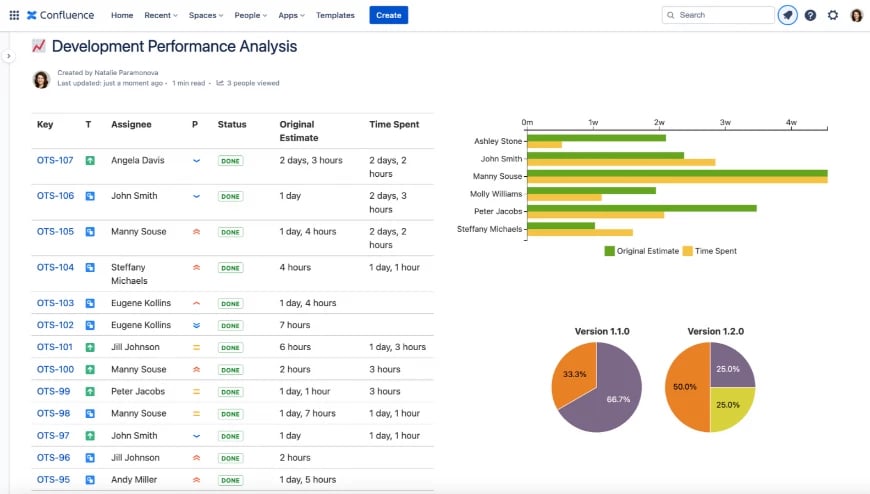
Table Filter and Charts for Confluence is an app for running business analysis in Confluence, filtering any kind of data, summarizing it and visualizing with dynamically updated charts.
Get started!
Powerful tool for managing table data
Apply relevant filters (free text, visual, dropdown and many more) to any of your table columns. Summarize and calculate data in pivot tables. Build a variety of charts and graphs, including Gantt
Our Services:
Consulting
We are happy to advise you in detail and personally regarding the Atlassian products and our services around Atlassian.
Configuration
Talk to our experienced consultants who analyze potential and agree with an optimization plan.
Support
No matter if you are new to the Atlassian Suite or just need a hand with a certain topic – we are glad to help.
Development
Do you need special functions that are not covered by any existing app? We develop your own apps individually adapted to your needs.
Hosting
We are helping you to reach the availability that you need by offering several different service level categories with up to 99.9% availability.
Trainings
Teams of up to 8 can schedule private sessions, either online, or we’ll come to your site and deliver Team (Onsite) classes.
Licenses
We offer attractive package benefits and advise on advantageous options for buying or extending Atlassian licenses.
Optimization
We stabilize your atlassian systems and make sure they always run perfectly!
Your contact person:

Competences:
Atlassian Licenses, App Licenses, Consulting


.png?width=64&height=64&name=ITIL%20Foundation%20(2).png)


